
How to Critically Appraise a Cross-sectional Study

Table of Contents

Overview

A cross-sectional study is like a snapshot of health in a population at one point in time. To trust its findings, we must critically appraise how it was done. This means checking if the report follows standards like STROBE (Strengthening the Reporting of Observational Studies in Epidemiology), if the sample fairly represents the population, and if bias or confounding are addressed. We also ask: does the data really support the conclusions? Each section below covers a key aspect of appraisal with practical tips and examples.

Using the STROBE Checklist for Cross-sectional Studies

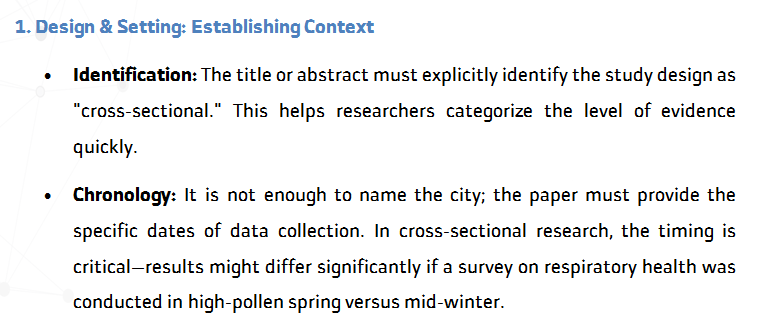
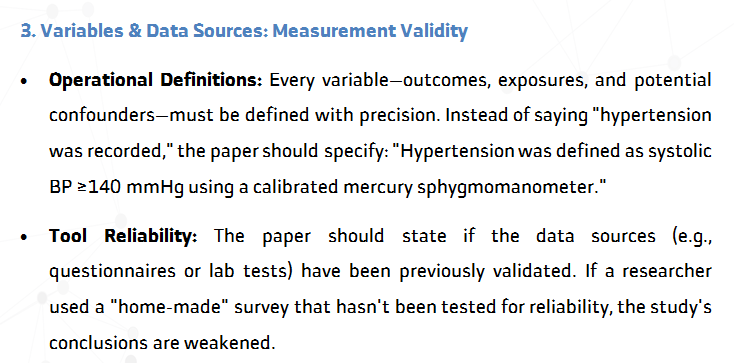
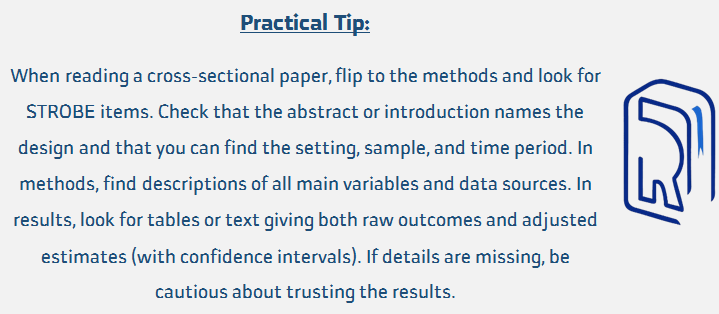
The STROBE (Strengthening the Reporting of Observational Studies in Epidemiology) checklist is the gold standard for reporting transparency. For cross-sectional studies—which capture a “snapshot” of a population at a single point in time—clear reporting is vital to determine if the findings are reliable or merely a result of chance and bias.

When appraising a paper, look for the following criteria:

Note for Appraisers:

Failure to adhere to STROBE items does not automatically imply poor research quality, but it does indicate a lack of reporting transparency. Without these details—such as a clear description of variable measurement or confounder adjustment—it becomes difficult for readers to assess the study’s internal validity or to trust that the conclusions are supported by the data.

Assessing Sampling and Representativeness

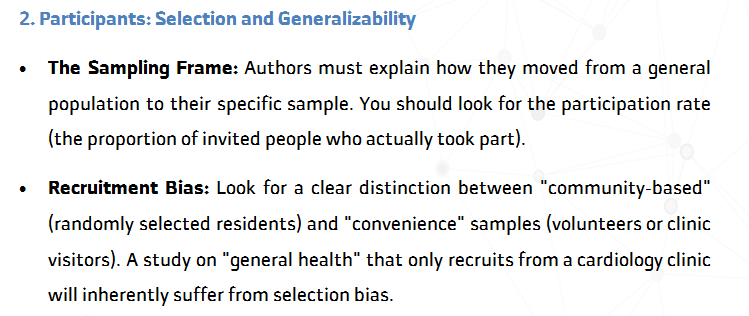
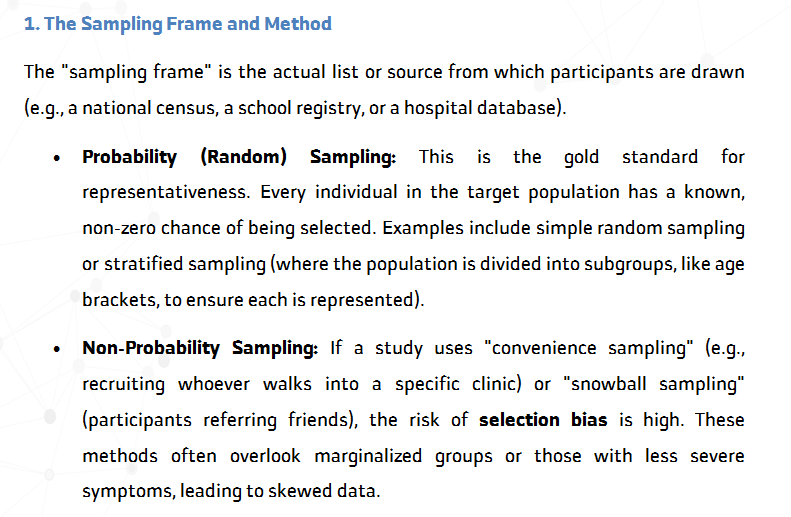
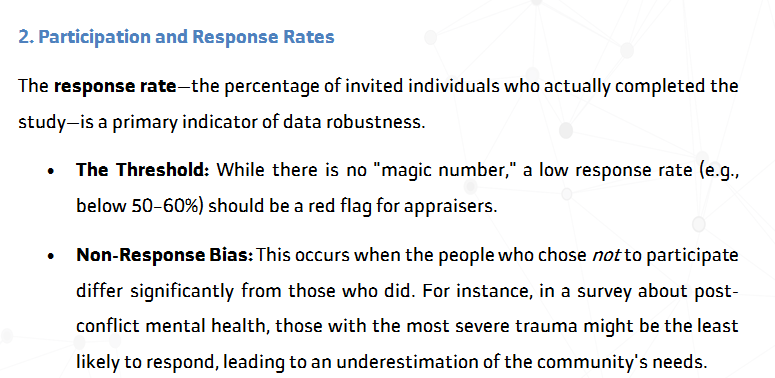
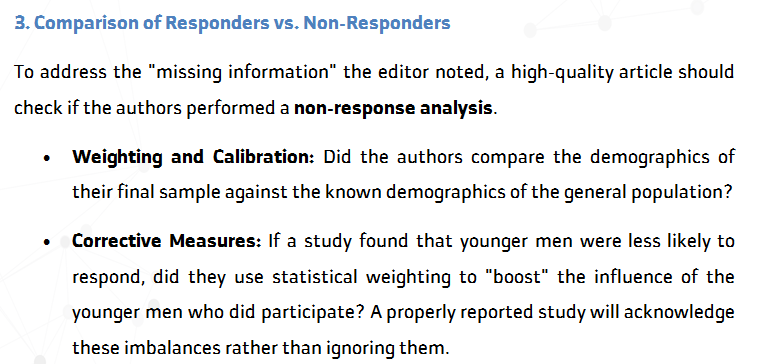
A fundamental goal of any cross-sectional study is to ensure that the findings can be generalized to a broader population. This depends entirely on representativeness. If the sample does not mirror the target population’s characteristics (age, sex, socioeconomic status, or disease severity), the study’s conclusions may only apply to the participants themselves, rather than the “real world.”

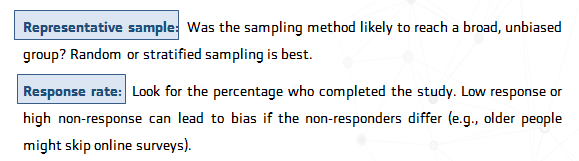
When appraising this section of a paper, look for these three pillars of sampling quality:

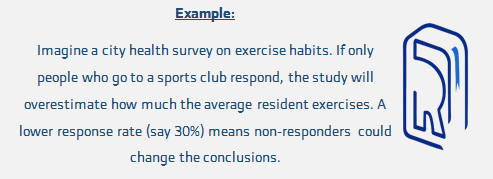
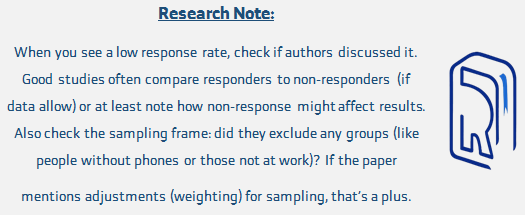
A good report will give the response rate and, if possible, compare key traits of responders vs non-responders. Note that very high response rates (e.g., >90%) reduce bias, but do not eliminate it.

Identifying Biases and Confounding

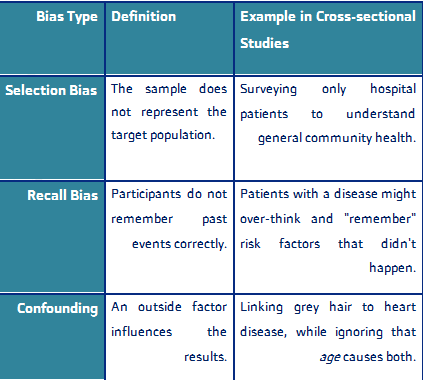
All research can have bias, systematic errors that distort findings.

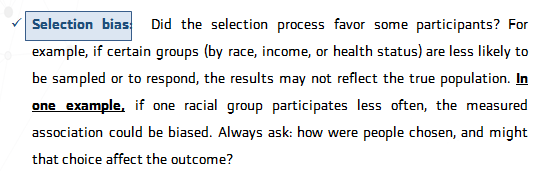
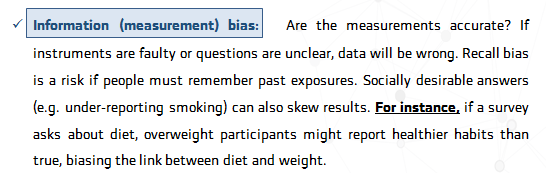
In cross-sectional studies, two common types are selection bias and information (measurement) bias:

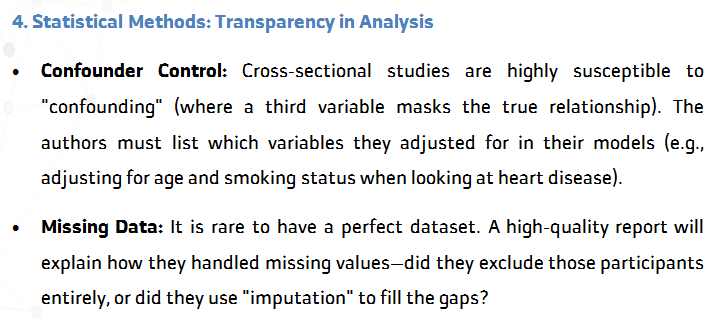
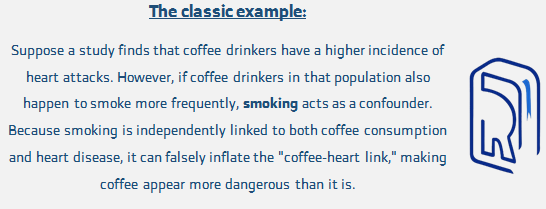
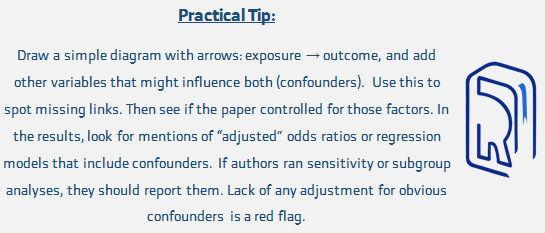
Confounding is a specific type of distortion where the relationship between an exposure and an outcome is obscured by a third factor. To be a true confounder, a variable must be associated with the exposure, be an independent risk factor for the outcome, and not be a step in the causal pathway.

Evaluating the Strength of Conclusions

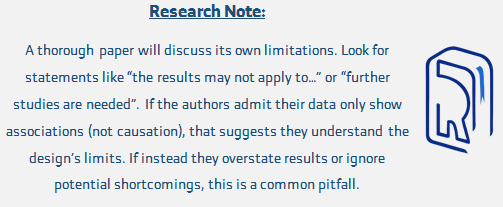
Finally, ask: Do the data truly support what the authors conclude? Cross-sectional studies can show associations, but they cannot prove one thing causes another. Be wary of causal language. For example, if an article finds that people who walk more have lower blood sugar, it might conclude “walking reduces diabetes risk”. But in a cross-sectional design, we cannot know if healthier people choose to walk more, or if walking led to better health. As one methodology guide warns, “it is difficult to derive causal relationships from cross-sectional analysis”.

Also consider generalizability. Even if the study is well done, its findings only apply to similar settings. If the sample came from one clinic or a specific city, the results might not hold elsewhere. Setia’s example notes that a clinic-based survey’s prevalence “may have limited generalizability” to the broader population. So check if the authors discuss to whom the results apply.

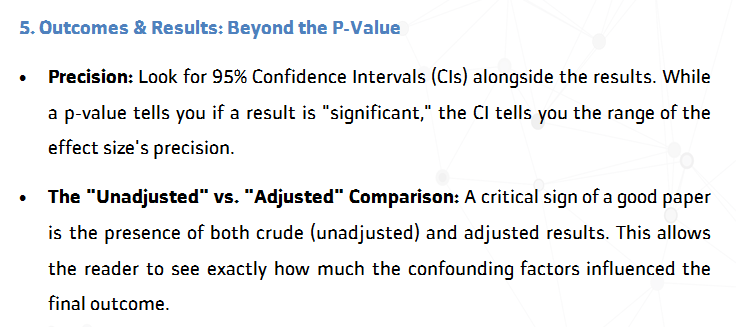
Supported conclusions:  Compare the conclusions to the actual results. If the authors claim an effect, ensure the statistics back it up. Did they report confidence intervals or p-values? Claims beyond the scope of the data (e.g., implying cause when only association is shown) weaken the study.

Applicability:  Consider if the study setting/population matches your interest. If not, take conclusions with caution. Good papers will acknowledge limitations on generalizability.

Comparison Table: Types of Bias

Common Mistakes

When appraising or writing these studies, avoid these errors:

  1. Confusing association with causation: Remember that cross-sectional data are a snapshot; they cannot prove cause-and-effect. Beware of conclusions that imply causality (e.g. “X leads to Y”).
  2. Overgeneralizing from a non-representative sample: If the study group is unusual or narrowly defined, its findings may not apply broadly.
  3. Ignoring bias and confounding: Some critiques assume the study is fine without checking for selection bias or unadjusted confounders. Always check these issues.
  4. Skipping critical details: For example, not verifying how outcomes were measured or what statistical tests were used. Missing or poorly reported methods can hide problems.
  5. Neglecting to consider study limitations: A good critique notes what the authors missed – such as a low response rate or missing data – rather than accepting claims at face value.

Key Takeaways

  • Use checklists: The STROBE checklist (and similar guides) helps ensure a cross-sectional study is reported completely. Make sure setting, participants, variables, data sources, outcomes and methods are all clearly described.
  • Check the sample: A valid cross-sectional study should use a sampling strategy that reflects the target population. High response rates and inclusive sampling protect against bias.
  • Spot biases and confounders: Actively look for selection or measurement biases and whether key confounders were identified and adjusted for. A careful diagram or list of potential confounders can guide your appraisal.
  • Be cautious with conclusions: Data may show correlation but not prove causation. Verify that the authors’ claims match the evidence. Think critically about whether the findings can apply to other settings or populations.
  • Practice evidence-based skepticism: Always match the conclusions to the data. If something seems too good to be true, double-check the numbers, methods, and any supplementary analyses.

References

  1. von Elm, E., Altman, D. G., Egger, M., Pocock, S. J., Gøtzsche, P. C., Vandenbroucke, J. P., & STROBE Initiative (2008). The Strengthening the Reporting of Observational Studies in Epidemiology (STROBE) statement: guidelines for reporting observational studies. Journal of clinical epidemiology, 61(4), 344–349. Link
  2. Setia M. S. (2016). Methodology Series Module 3: Cross-sectional Studies. Indian journal of dermatology, 61(3), 261–264. Link
  3. Ramke, J., Palagyi, A., Kuper, H., & Gilbert, C. E. (2018). Assessment of Response Bias Is Neglected in Cross-Sectional Blindness Prevalence Surveys: A Review of Recent Surveys in Low- and Middle-Income Countries. Ophthalmic epidemiology, 25(5-6),379–385. Link
  4. Faculty of Public Health (UK). (n.d.). Introduction to study designs – cross-sectional studies. Health Knowledge. Link
  5. National Heart, Lung, and Blood Institute. (2021). Quality assessment tool for observational cohort and cross-sectional studies. National Institutes of Health. https://www.nhlbi.nih.gov/health-topics/study-quality-assessment-tools
  6. Levin, K. Study design III: Cross-sectional studies. Evid Based Dent 7, 24–25 (2006). https://doi.org/10.1038/sj.ebd.6400375

Authorship and Contributions

The following section acknowledges the individuals who contributed to the authorship, editing, translation, and preparation of this article, ensuring its academic integrity and clarity.

Dr. Ali Hmidoush

Author

M.D. and Medical Researcher; Director of Website & SEO Department at ResRef.

Dr. Hani Harb

Editor

Professor of Infectious Immunology at TU Dresden, where he leads a dynamic research program at the interface of immunology, metabolism, and environmental health.

Lamyaa Okko

Lamyaa Okko

Translator & Formatter

Occupational Therapy Student, ResRef's Website and SEO Team Member

Facebook
Telegram
LinkedIn
Email

Leave a Comment

Your email address will not be published. Required fields are marked *

Realted Articles

Cross-sectional Studies

How to Critically Appraise a Cross-sectional Study

Transform your raw cross-sectional data into scientifically meaningful results. This practical guide explains descriptive analysis, measures of association, and how to accurately interpret your findings without overstating causation.

Read More »
Cross-sectional Studies

Analyzing and Interpreting Cross-sectional Data

Transform your raw cross-sectional data into scientifically meaningful results. This practical guide explains descriptive analysis, measures of association, and how to accurately interpret your findings without overstating causation.

Read More »
Cross-sectional Studies

Designing a Cross-sectional Study

Learn the essential steps to design a robust cross-sectional study. Explore target populations, questionnaire development, validity, and how to address temporal ambiguity in your research.

Read More »
Scroll to Top